Project Overview
Still Shipping Six Years Later
Overview
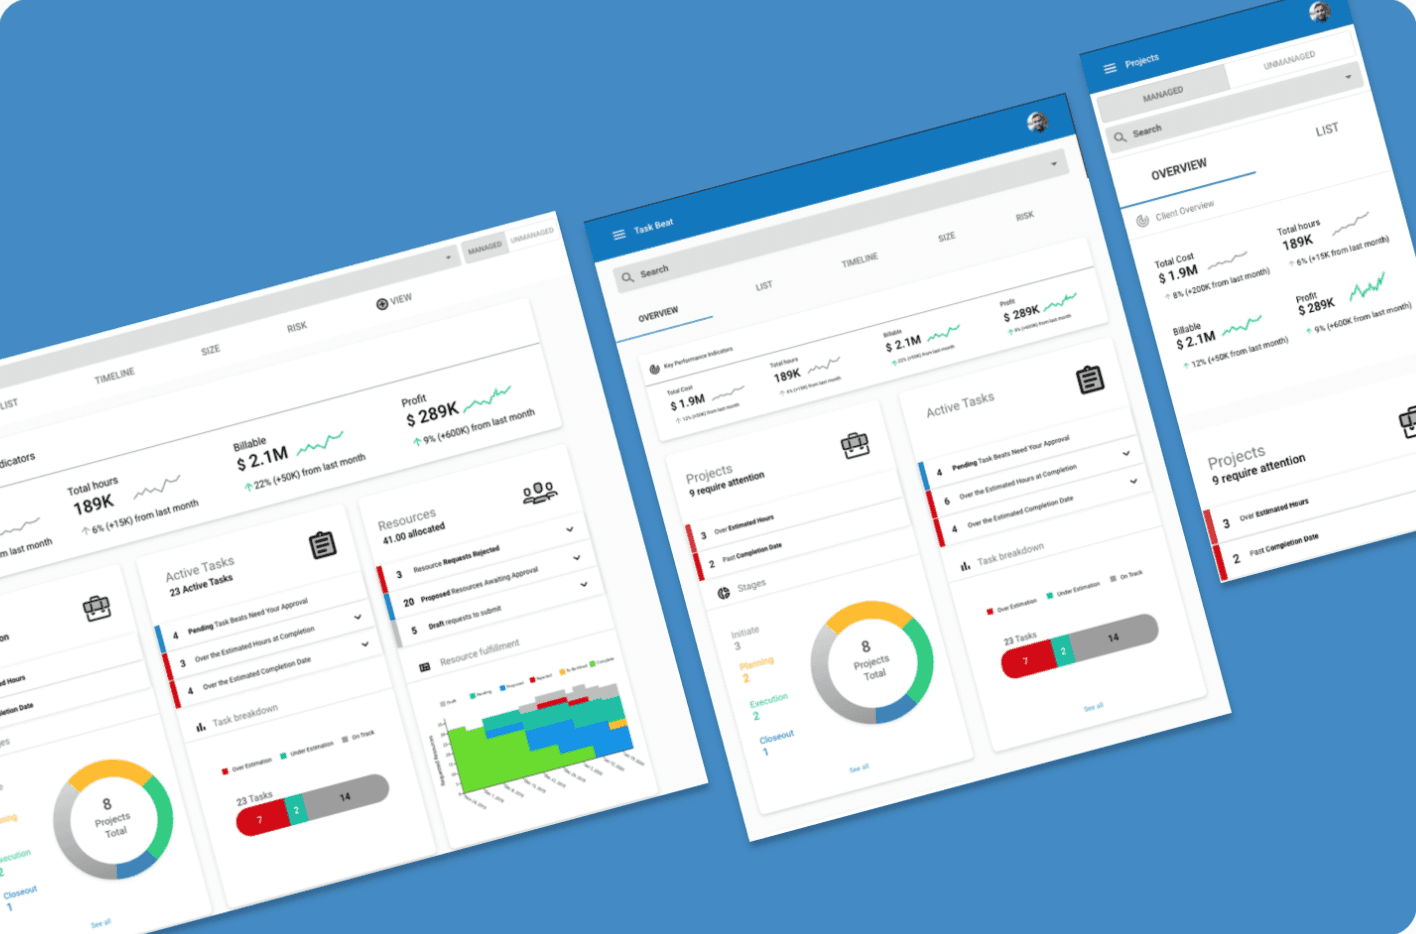
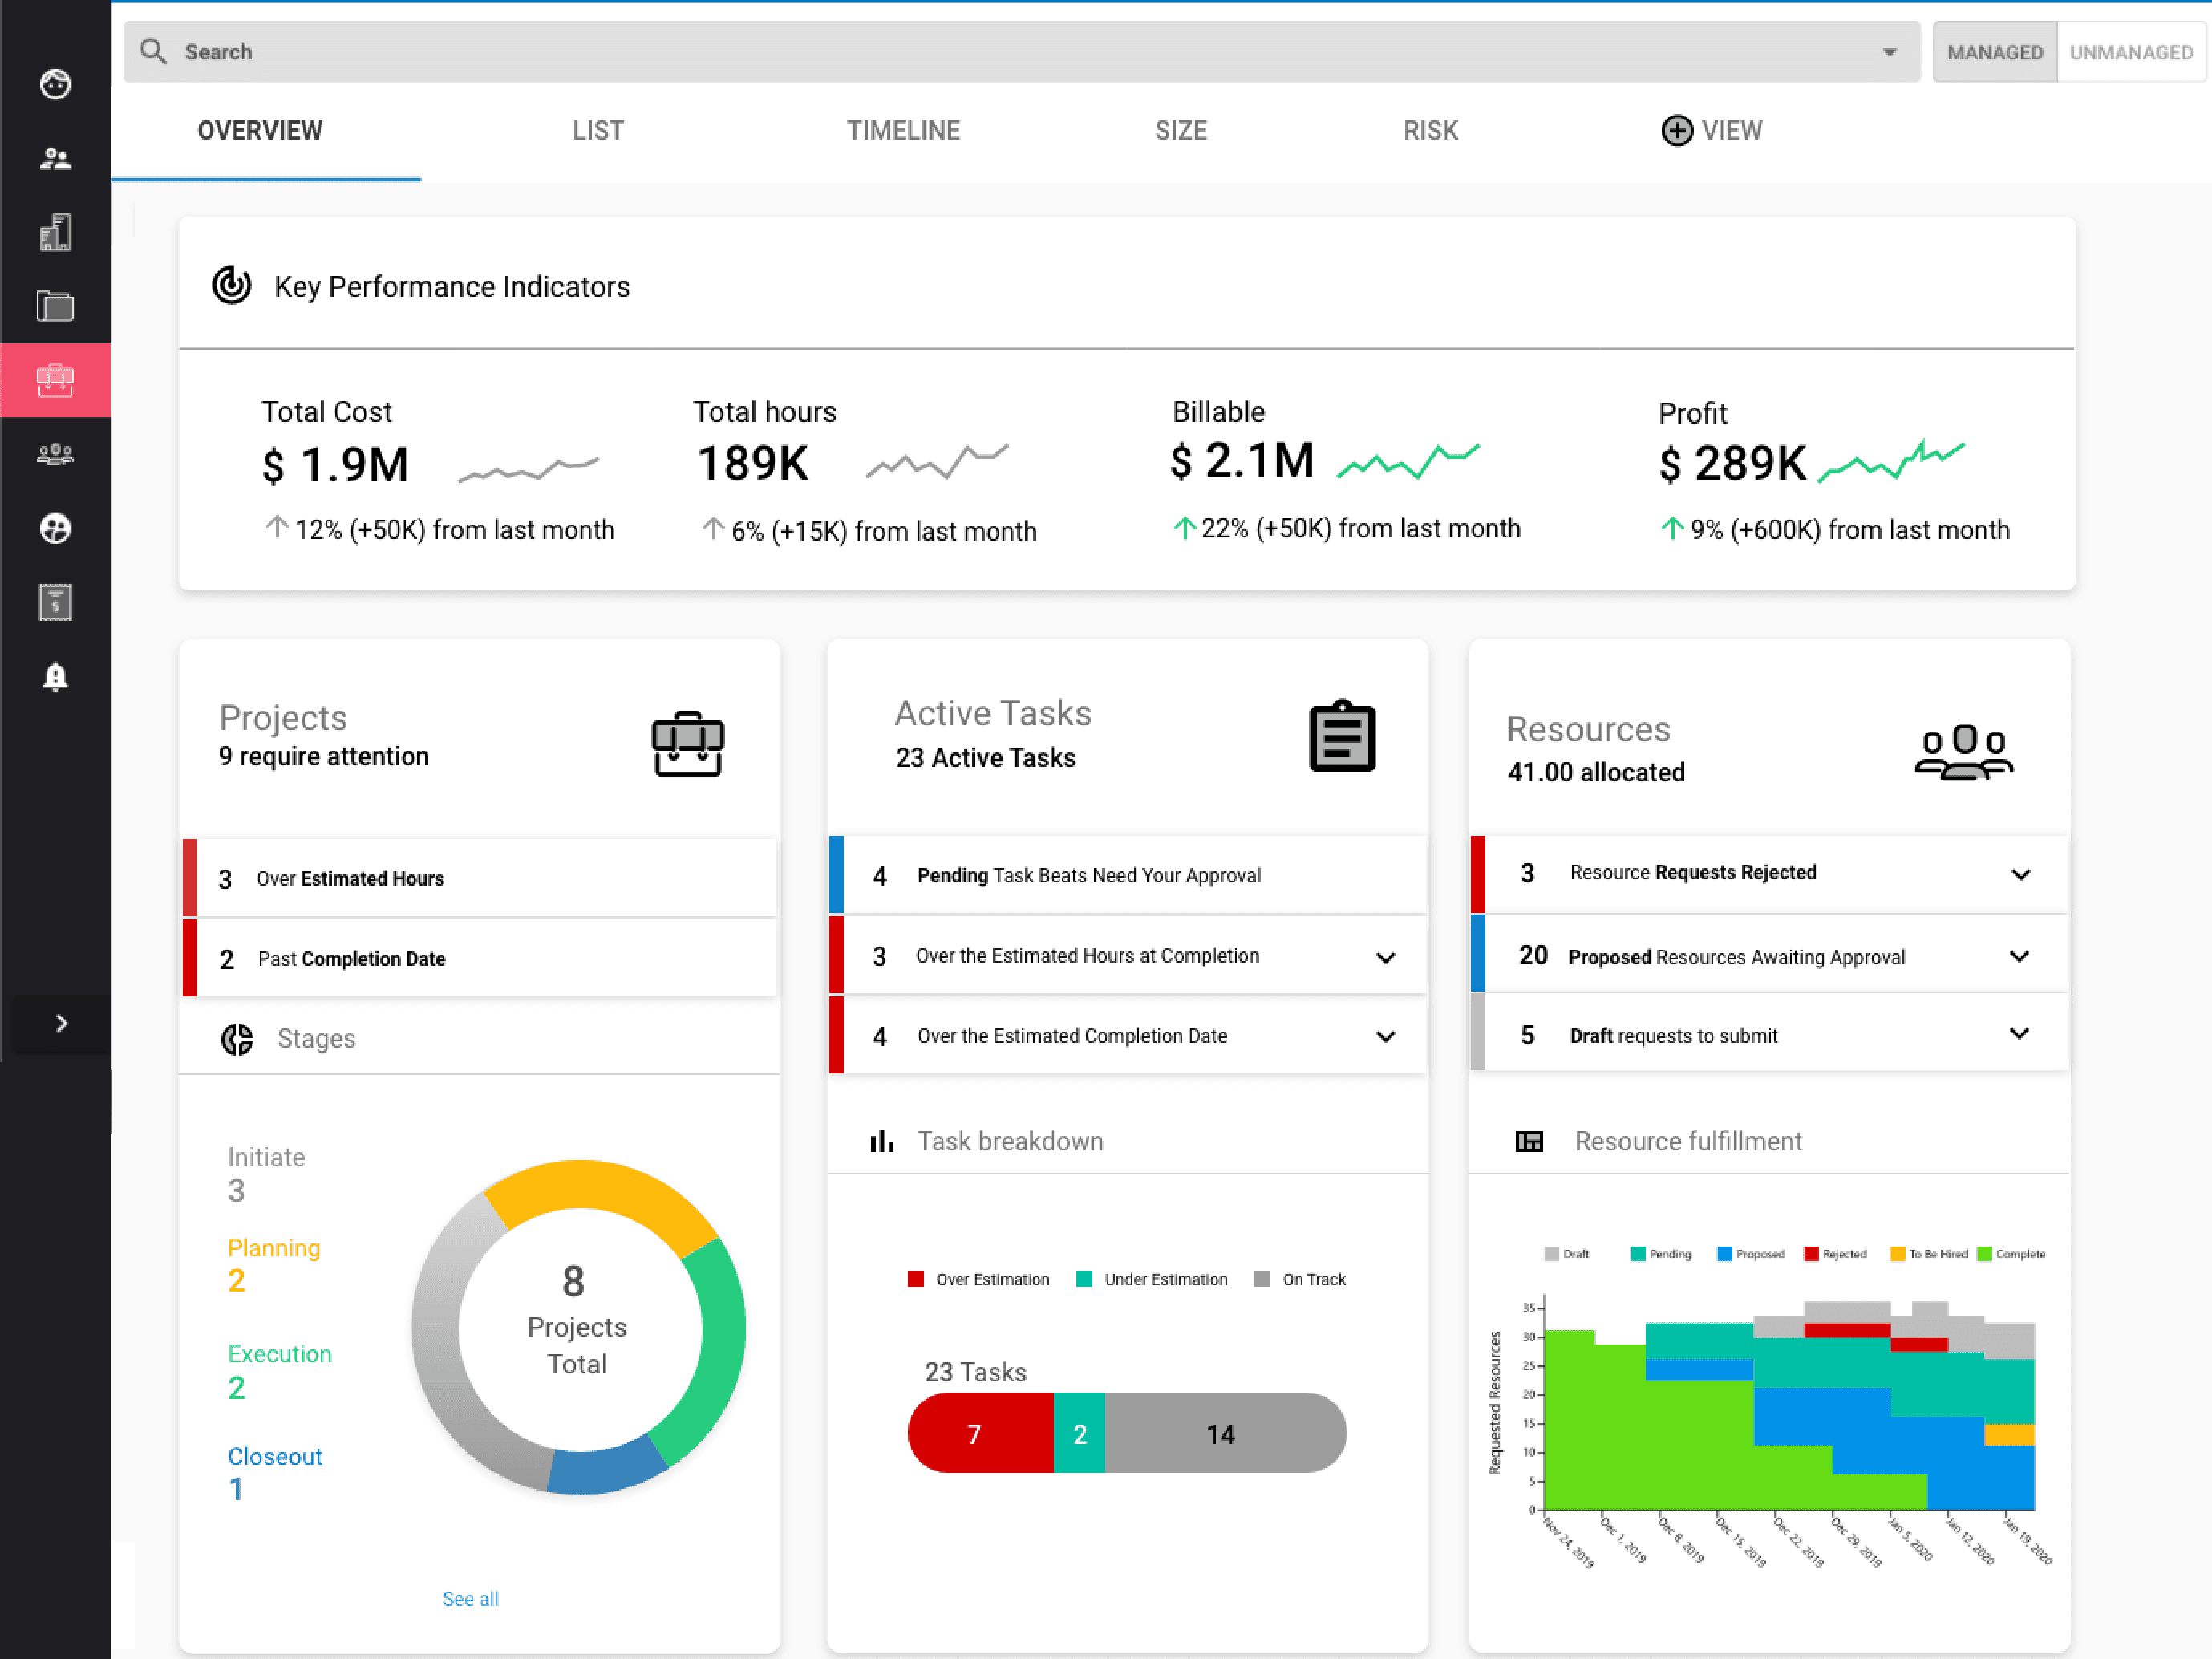
I pulled scattered operational data into a single view managers could scan to catch project problems early. It helped close deals in 2020 and is still in the product today, largely unchanged, showcasing my ability to find a structure durable enough to outlast the trends around it.
The problem
Too much data, no hierarchy. We had a list page of all the projects, but for Project Managers overseeing multiple projects at a time, it was unclear about priorities and a big picture of how they were doing.
Research
Why: Managers overseeing multiple projects had the information they needed to catch problems early, but it lived across different screens and systems. By the time a pattern was visible, it was usually a problem.
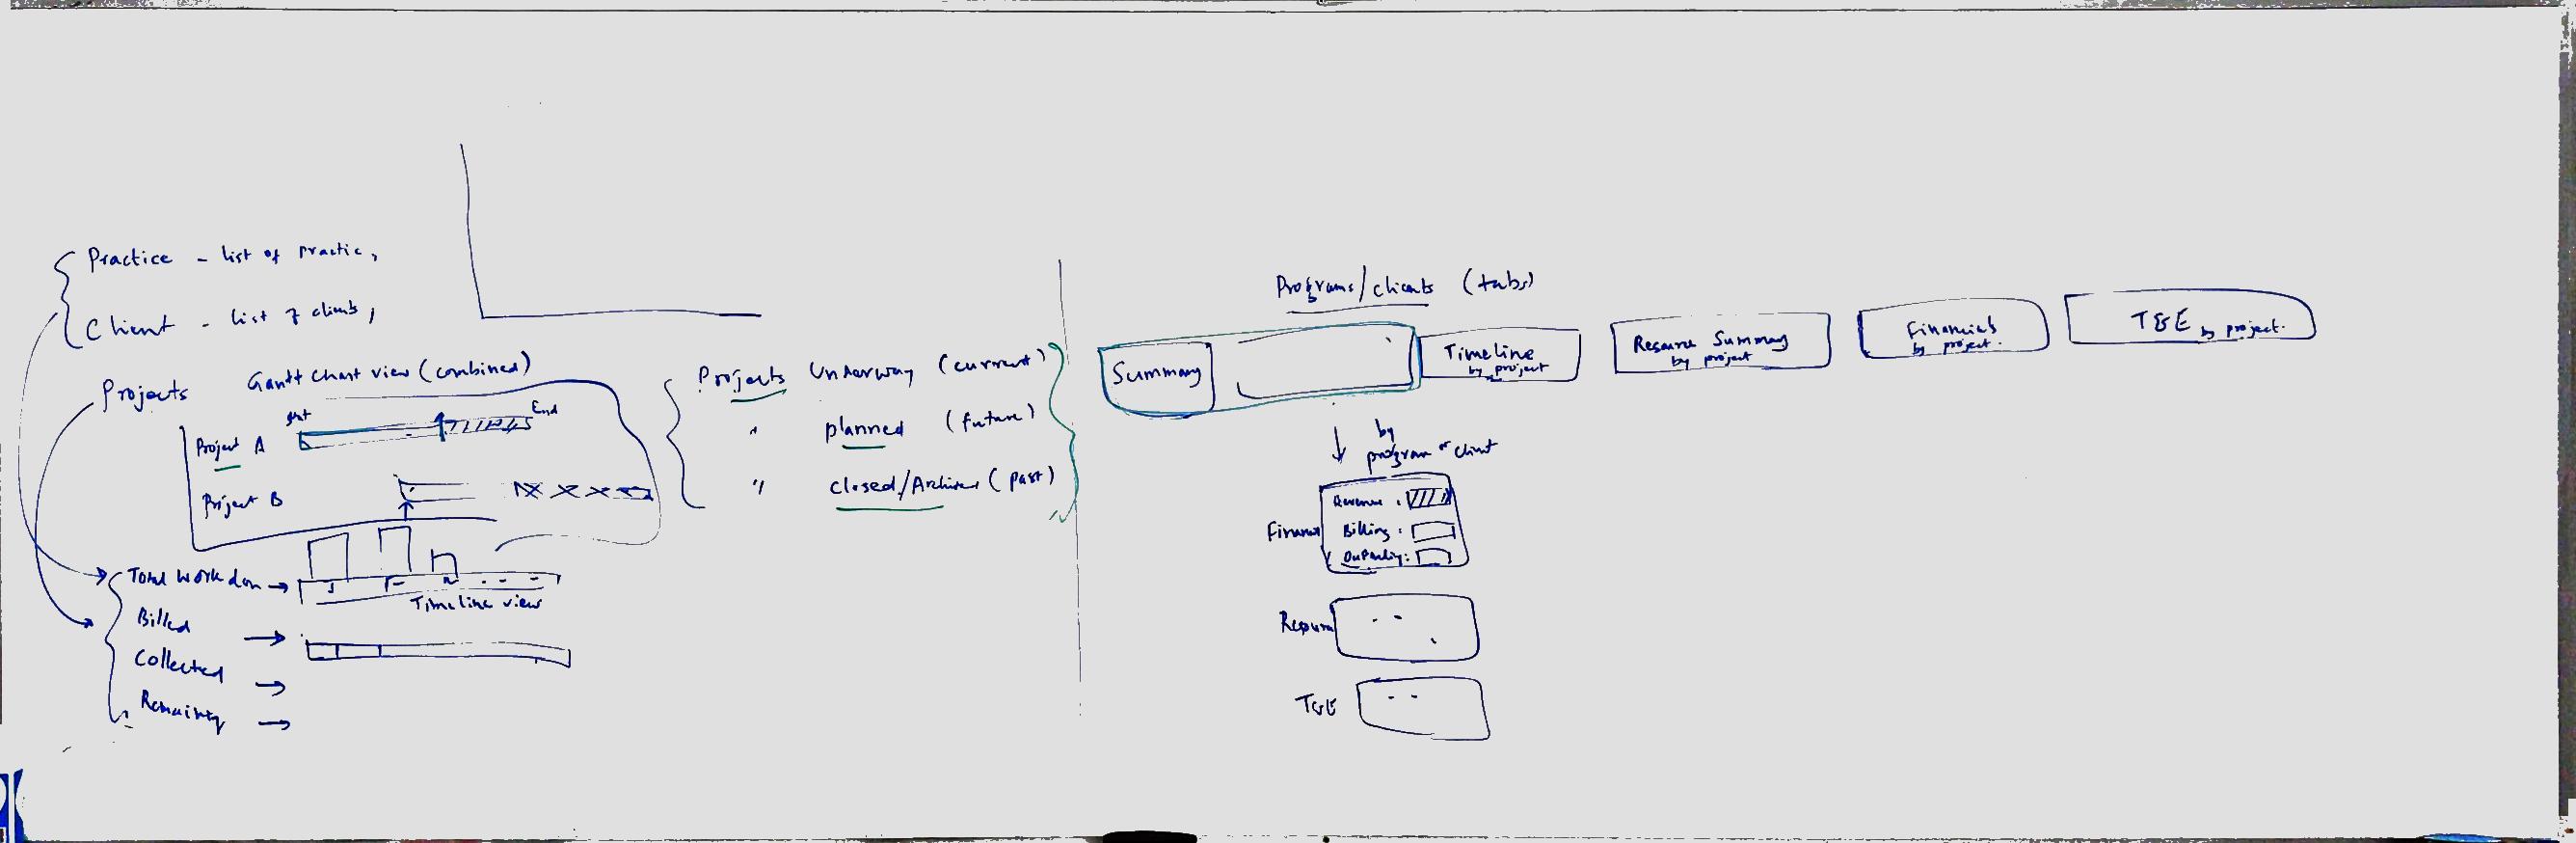
Methods: Workshops with project managers and operations leads, plus competitive analysis of how other platforms structured project health. I also had to account for a wide range of users in one view, from people checking in occasionally to operations leads living in the product daily.
What we found: Completeness was the enemy. The instinct was to show everything available, but managers scanning a dashboard between meetings needed the few things that indicated something was off, not the full picture. Density made the view less useful, not more.
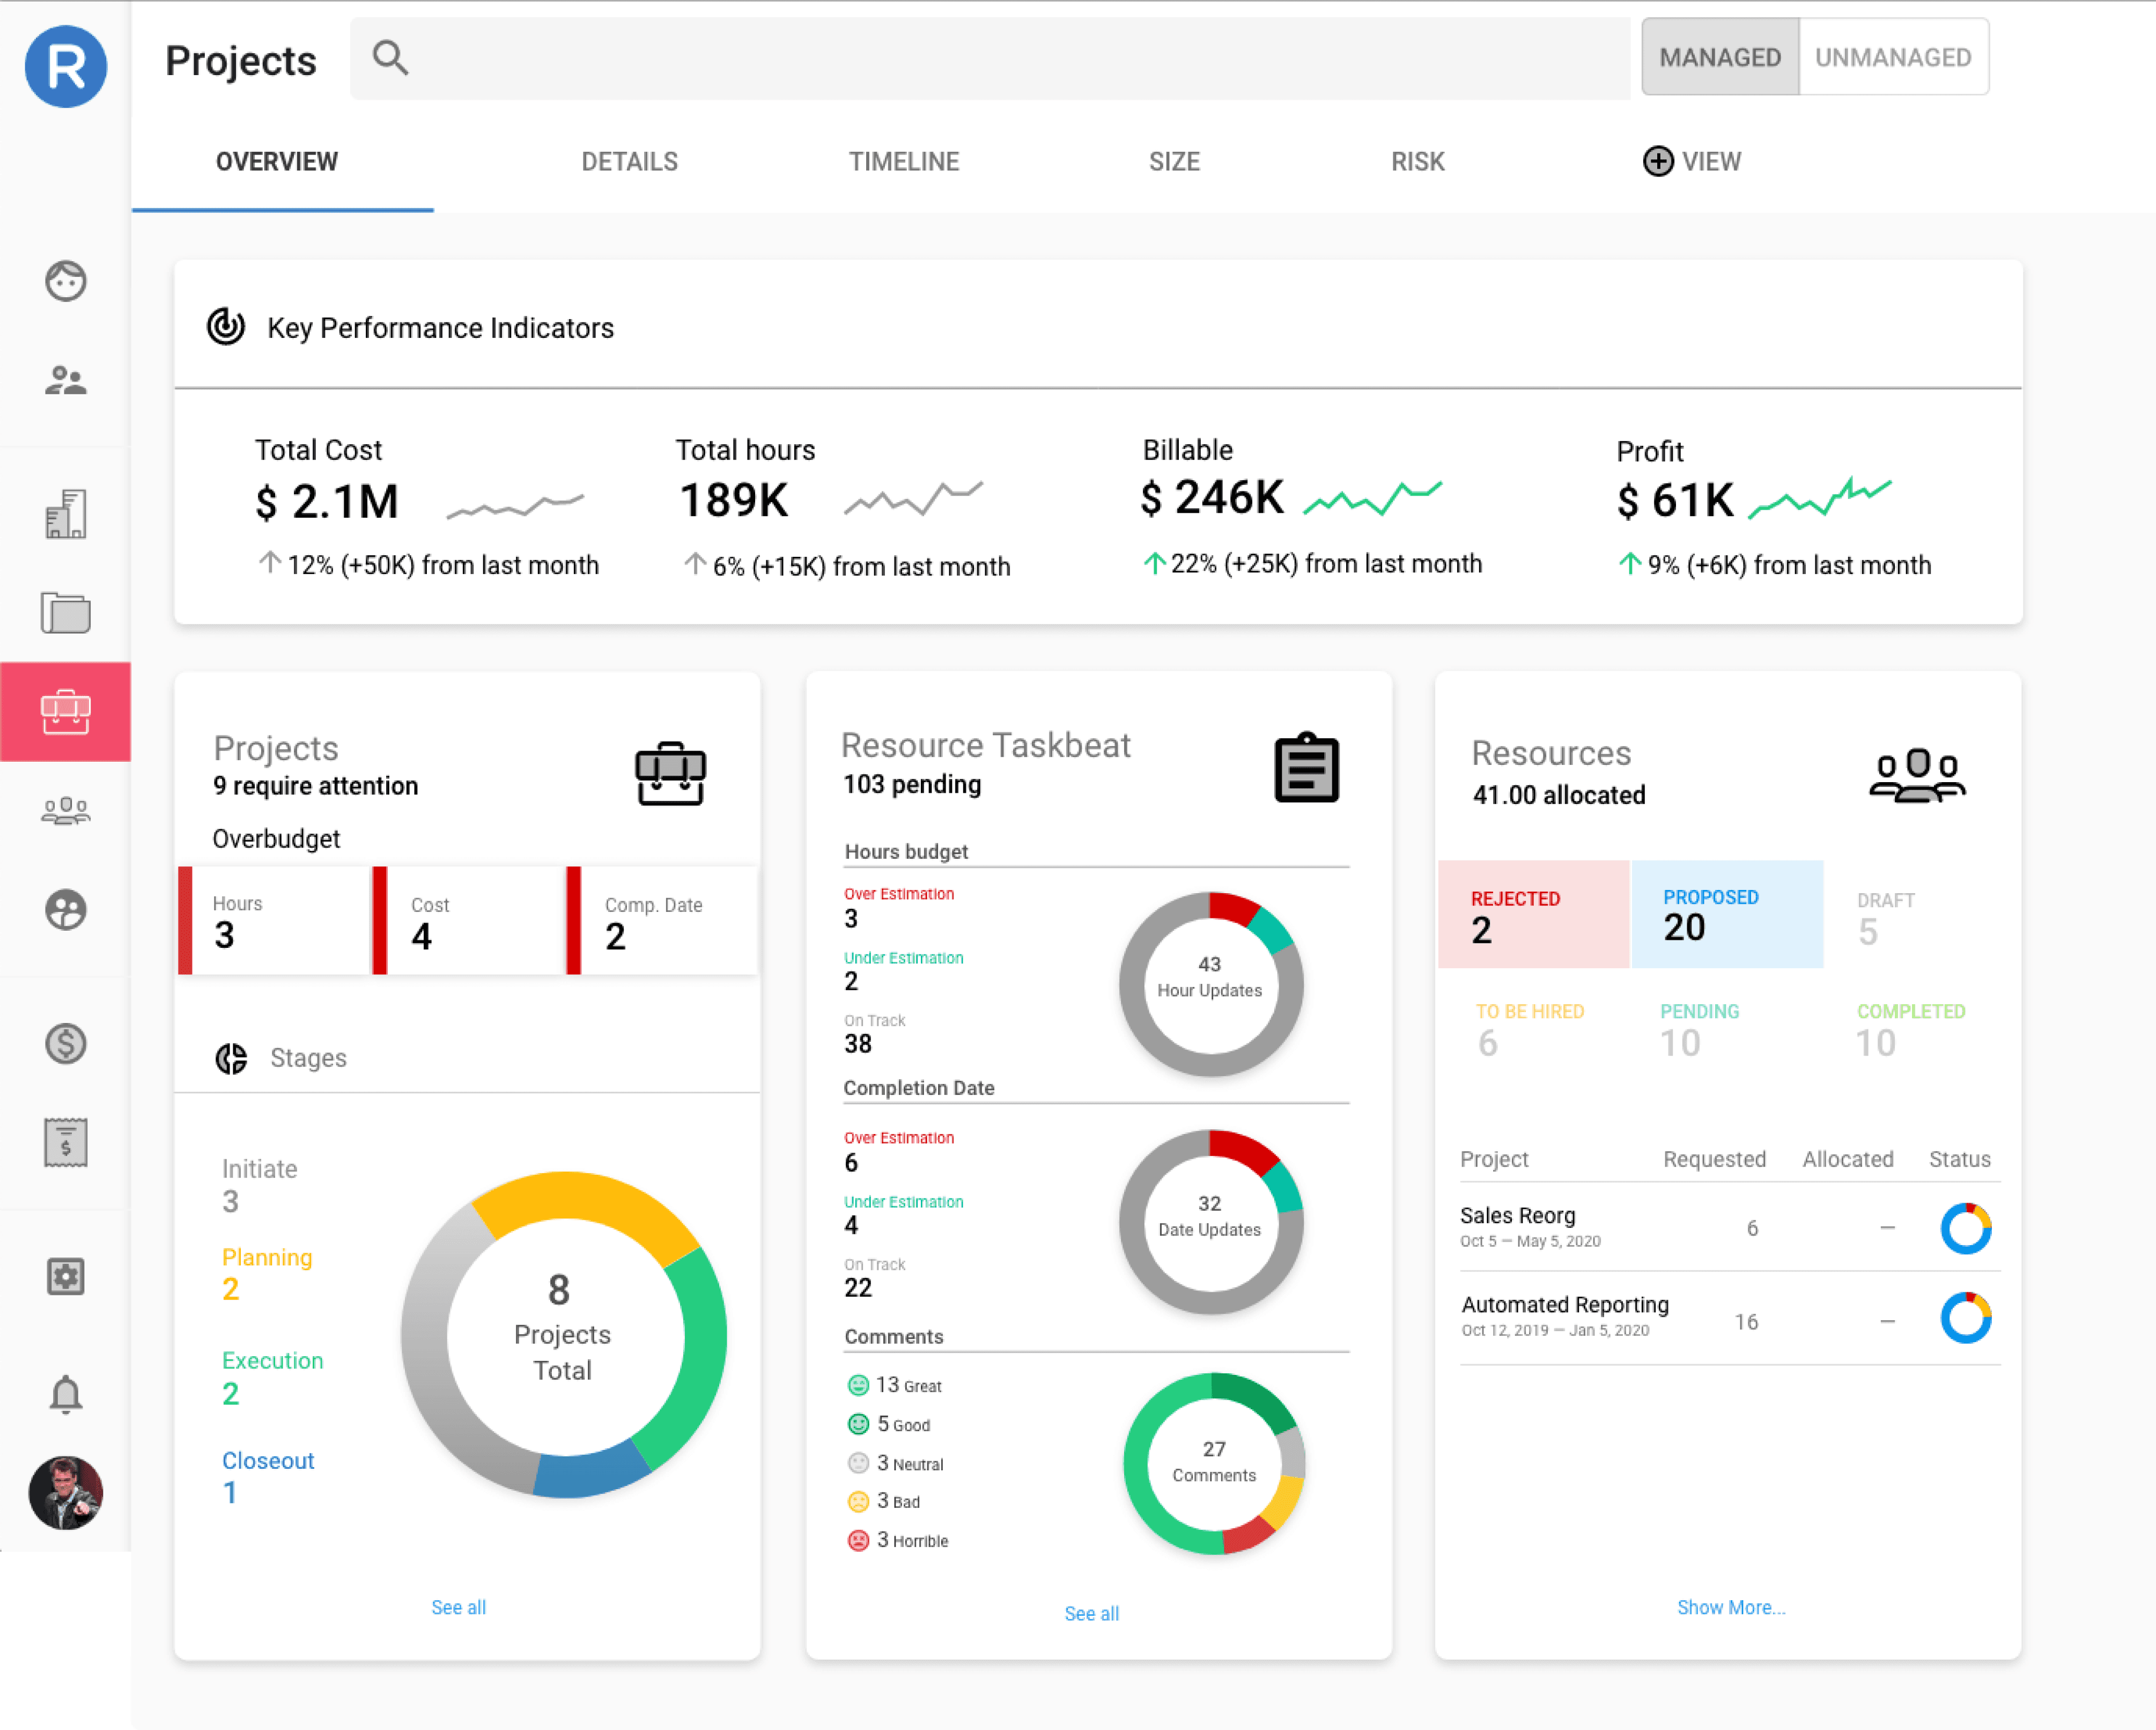
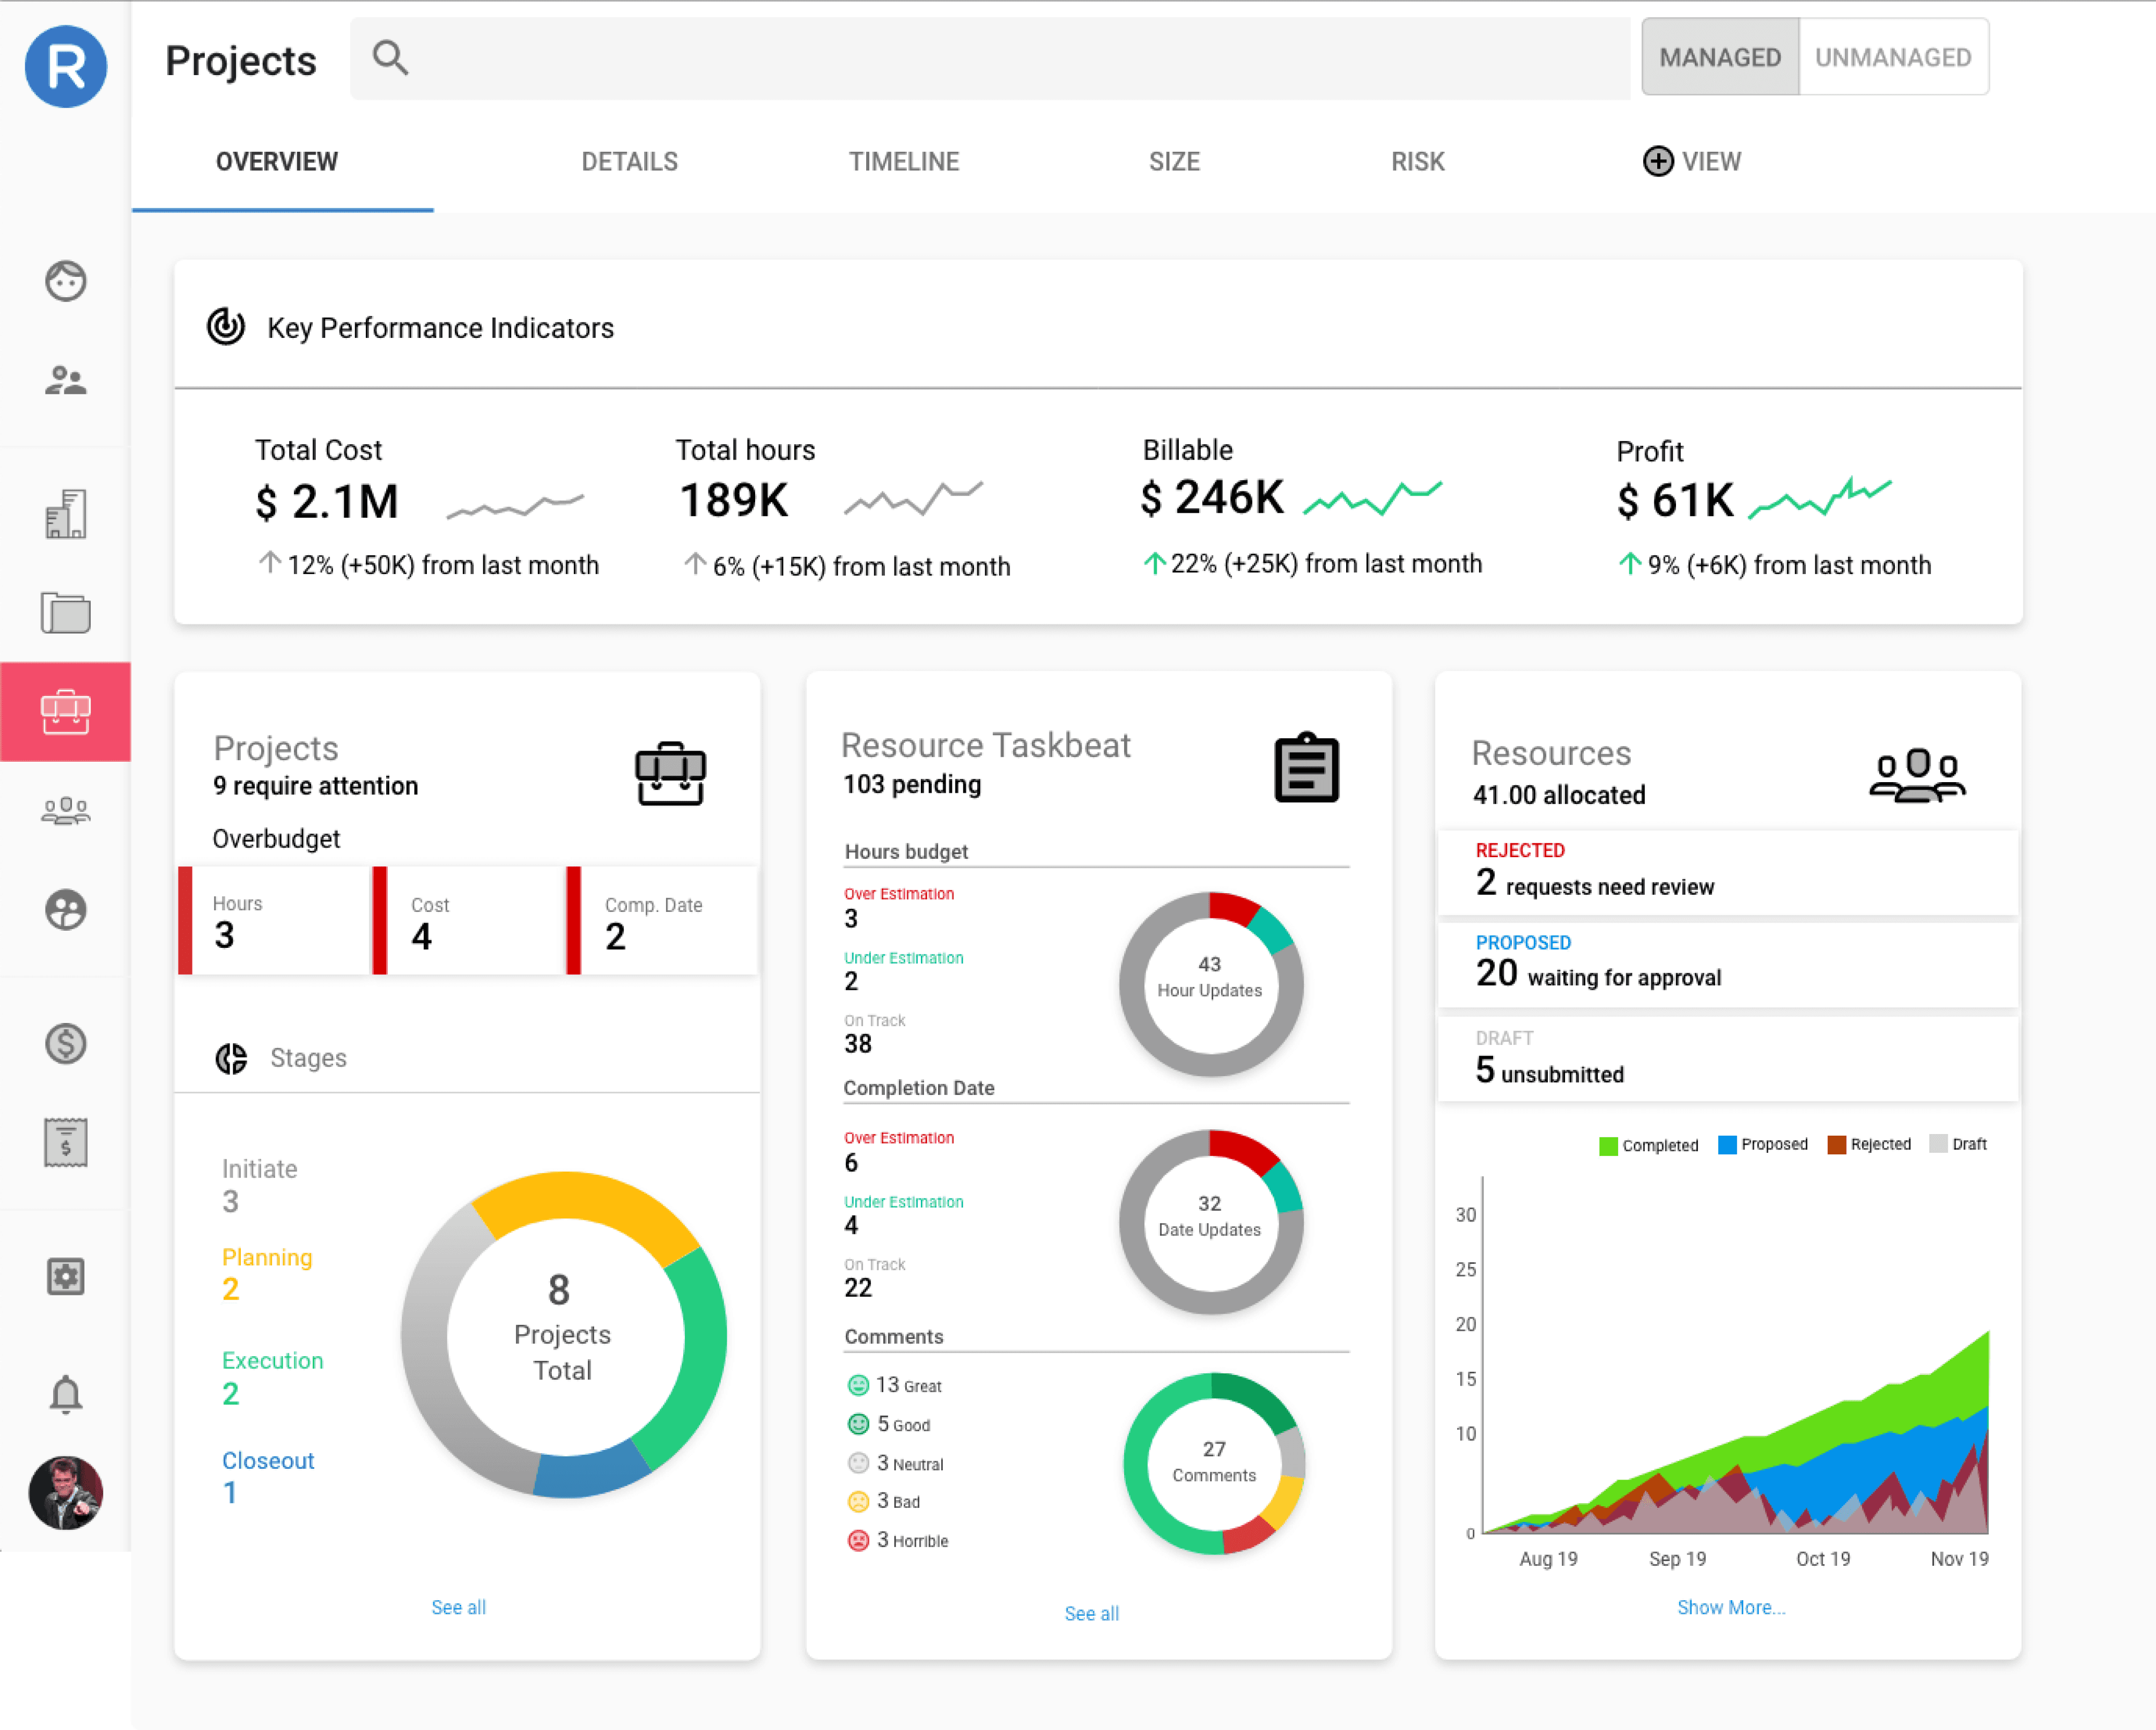
What changed because of it: I prioritized the signals that actually predicted trouble, KPIs, timeline, and status, and cut the rest, despite pressure to surface more. That editorial decision is why the structure held up. Six years of feature additions later, the underlying model still works, which is the outcome I'd point to over anything visual.
Key decisions
Simplify ruthlessly. There was too much data to consolidate on an overview, so I worked closely with our PMs to decide what the most important data points were that we could summarize and take action on.
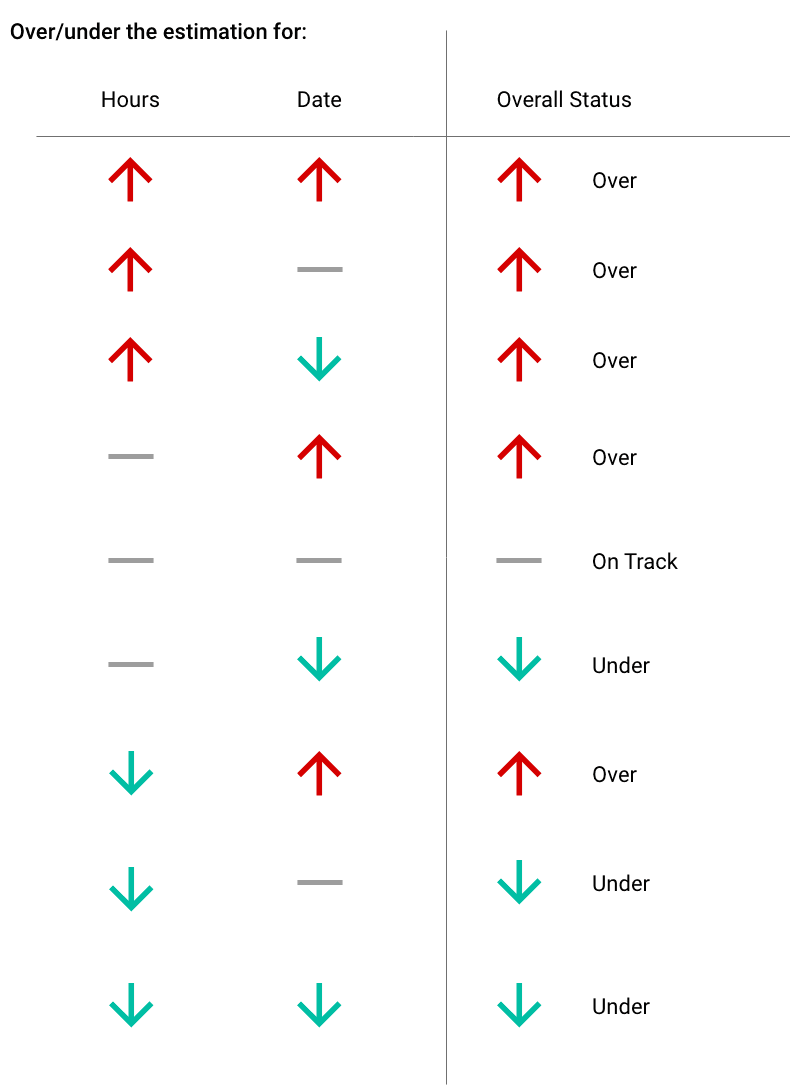
Encode judgment into the system. The trend lines and arrows (expanded below) on the KPI card meant every metric communicated direction at a glance without a legend. This gave PMs a starting point about how their projects were doing month to month.
Keep it legible. It was important for me to keep the graphics light and easy to understand quickly so that users weren't overwhelmed with the amount of data we were providing.
Outcome
• The design helped sell the product: It was used in sales demos and cited by prospects.
• Longevity: the design is still in the product today, six years on.